Creating a Donut Chart: A Comprehensive Overview

In the digital age, the right visualization of data can make all the difference. One of the
most popular and effective tools to do this is the donut chart. Below, we will go into
further detail about what it is, why you should use it, and tips for creating a donut chart.
Understanding the Basics of Donut Chart

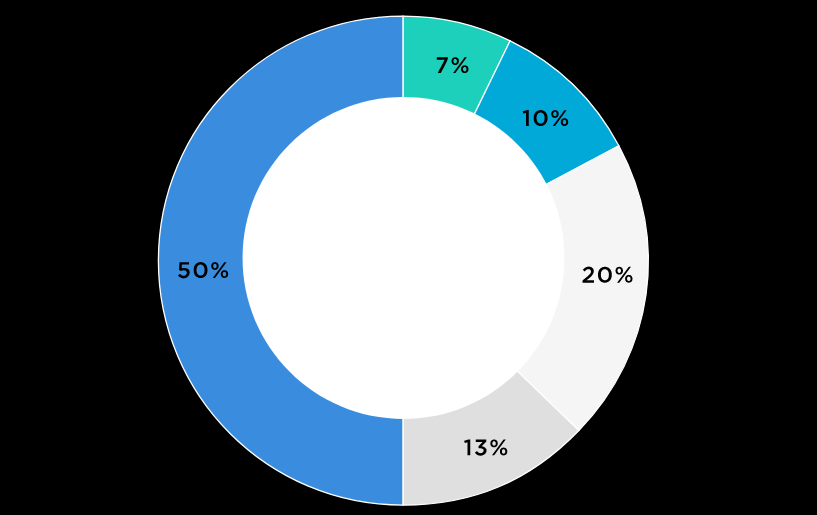
At its core, a donut chart is essentially a pie chart with a hole in the center. It’s used for
representing statistical data in a way that’s both visually appealing and easy to
understand. Like the pie chart, the donut chart shows the relationship of parts to a
whole, but its central void can also hold additional information or graphics if required.
The circle of the donut chart represents the total data set, while each slice corresponds
to a portion of that data. Its ring-like structure makes it possible to compare different
sections accurately and instantly.
Donut charts can be either two-dimensional or three-dimensional, depending on the
complexity of the data and aesthetic preference. Multi-layered donut charts, often called
nested donut charts, can even be used to represent hierarchical data.
A key advantage that differentiates donut charts from other data visualization tools is
their ability to visualize more than one data series in a compact, non-overlapping format.
This effortlessly leads to a well-organized and efficient representation of complex data.
Importance of Donut Chart in Data Visualization
Data visualization stands as a crucial element in modern decision-making. It takes raw
data and turns it into a visual context, aiding in understanding patterns, trends, and
correlations.
Donut charts, due to their inherent structure and flexibility, offer dynamic possibilities for
visualizing multiple series of data simultaneously. They enable the reader to grasp the
essential parts of the data quickly and comprehend the story it tells.
Donut charts are particularly useful in business situations. They provide a quick and
unambiguous way of presenting data, making them perfect for slideshows, reports, and
presentations. Whether it’s to compare sales figures, monitor progress towards a goal,
or display survey results, donut charts can provide insights in an accessible and visually
appealing manner.
In addition to their versatility, donut charts are also visually appealing and engaging,
attracting and holding the viewer’s attention. It’s crucial to remember that the visual
impact of a chart plays a massive role in the viewer’s initial interaction with the data.
Step-by-step Guide to Creating a Donut Chart

Creating a donut chart, although quite simple, needs careful attention to detail to ensure
accuracy and relevance. The first step is collecting the data you want to articulate. This
involves defining the categories and the numerical values they represent.
The next step is to choose your preferred software to create the chart. This could be a
specialized data visualization tool or even a general-purpose application like Microsoft
Excel or Google Sheets.
Once you have the data and the software, you can begin creating the chart. The
interface for each tool varies, but the process generally involves entering data values,
defining categories, and creating the donut chart. You can then customize the chart to
enhance its appearance and functionality.
The final step is to evaluate the chart. Analyze whether it effectively communicates the
data and improves understanding. If necessary, tweak certain elements like labels,
colors, or the data itself for better representation.
Overall, donut charts serve as a useful tool for data visualization. Their visual impact
and adaptability make them an excellent choice for a wide variety of situations. If used
properly, a donut chart can simplify complex data and transform it into clear, actionable
insights.


